
Summary
Beginner’s guide to breakout and price action strategies. Learn how to trade breakouts with volume confirmation and read candlesticks, patterns, and levels.
Economic Data
- 📈 US FOMC Rate Decision and Press Conference: Dec 10, 2025
📚 Deep Dive 📚
Breakout & Price Action Strategies: Trading with Simplicity
Two of the most powerful strategies traders use are breakout trading and price action trading.
These strategies focus less on complex indicators and more on what the chart itself is showing.
At GAR Capital, breakout setups with high volume are a favorite, especially when paired with options contracts. Price action is the foundation behind those breakouts. Let’s dive in.
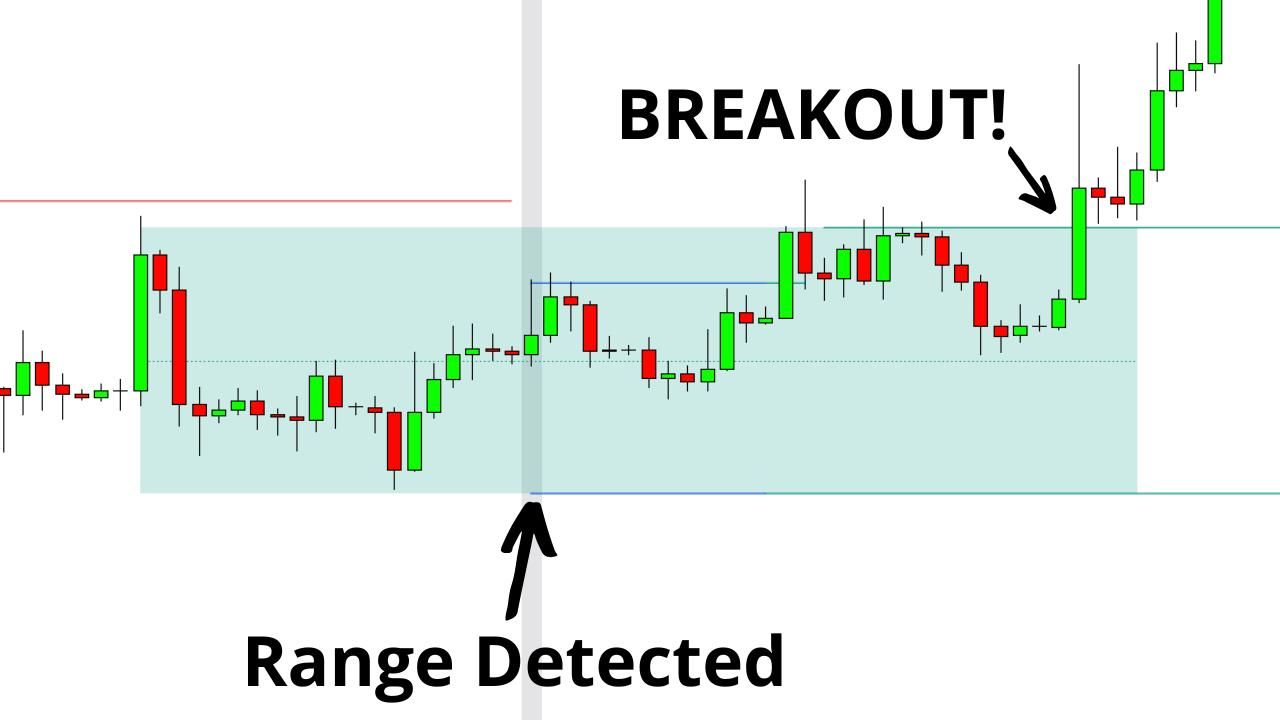
🚀 What is a Breakout?
A breakout happens when price moves above resistance (a ceiling) or below support (a floor) with strong momentum.
- Upside breakout → price pushes above resistance
- Downside breakout (breakdown) → price falls below support
👉 Example: If Tesla has been stuck under $300 for weeks, and then it explodes above $300 with huge volume, that’s a breakout.
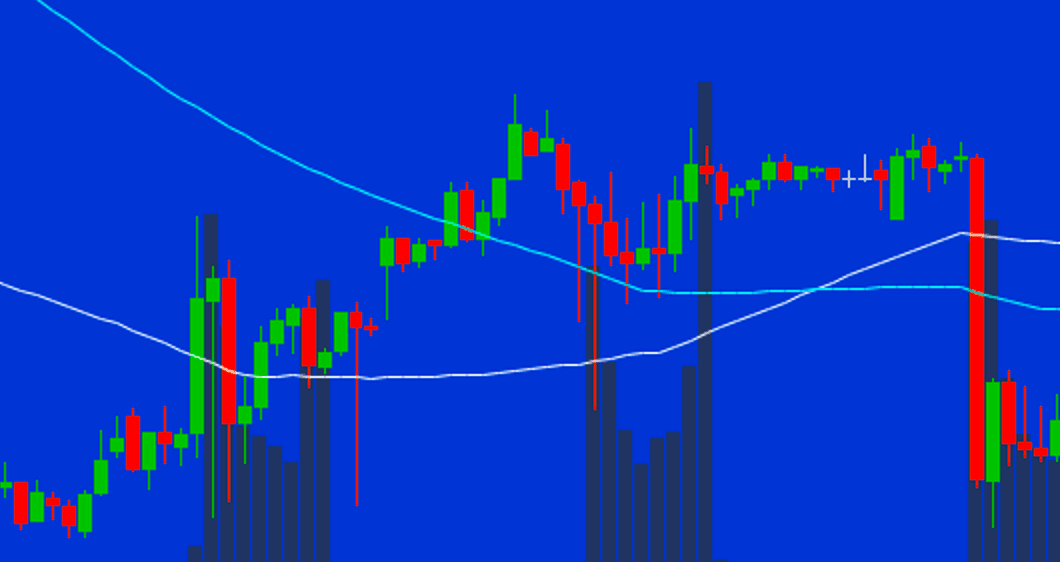
📊 Why Volume is Key
- A breakout on low volume often fails (fakeout).
- A breakout on high volume confirms traders are serious.
At GAR, we only consider breakouts worth trading when volume supports the move.
🔑 How Traders Trade Breakouts
- Identify key support/resistance zones.
- Wait for price to break through the level.
- Confirm with volume.
- Enter the trade (calls for upside, puts for downside).
- Place stop-loss near the breakout level in case it fails.
🧾 What is Price Action?
Price action means trading based on raw price movement — no clutter, no lagging indicators.
It’s about reading candlesticks, patterns, and levels to understand who’s in control (buyers or sellers).
Key Tools in Price Action:
- Candlestick Patterns (Doji, Engulfing, Shooting Star) → reveal market sentiment.
- Support & Resistance → the core building blocks of price action.
- Trendlines & Channels → show the path of price.
👉 Example: A bullish engulfing candle forming right at support is a price action clue that buyers are stepping in.
🔗 How Breakouts & Price Action Work Together
Breakouts are often price action events.
- A breakout candle above resistance is a price action signal of buyer strength.
- A breakdown below support with a bearish engulfing candle is also a price action signal.
Price action tells the story → Breakouts give you the entry.
📝 Example Trade
Netflix is stuck between $350 (support) and $400 (resistance).
- A price action trader sees a series of higher lows pushing into resistance.
- Finally, Netflix breaks above $400 with huge green candles and high volume.
- A breakout trader enters calls, using $400 as the new support.
This is both a price action strategy and a breakout strategy in one trade.
🚫 Common Mistakes
- Jumping into breakouts too early without waiting for confirmation.
- Ignoring volume — the difference between success and a fakeout.
- Overcomplicating charts with too many indicators instead of focusing on clean price action.
🎯 Quick Takeaways
- Breakouts = price escaping support/resistance zones with momentum.
- Price action = reading candles, patterns, and levels directly.
- The two work best together — price action tells the story, breakout confirms the trade.
- Always confirm with volume and use stop-loss protection.
🔑 Checkout Next Lesson: Time in Force Orders: GTC, IOC, and More
Checkout our New Options Course Here!
