Summary
Beginner’s guide to chart patterns. Learn how to read triangles, head & shoulders, double tops/bottoms, flags, and pennants to spot market moves.
Economic Data
- 📈 Prelim GDP q/q: Dec 23, 2025
- 📈 US Holiday - Christmas : Dec 25, 2025
📚 Deep Dive 📚
Chart Patterns: Triangles, Head & Shoulders, and More
Chart patterns are like the “shapes” that price makes over time. Traders watch these shapes to guess what price might do next. Think of it like reading body language — price is telling you if it’s tired, strong, or about to move.
🔺 Triangles
Triangles happen when price starts to “squeeze” between support and resistance lines. Eventually, the pressure builds up, and price usually breaks out in one direction.
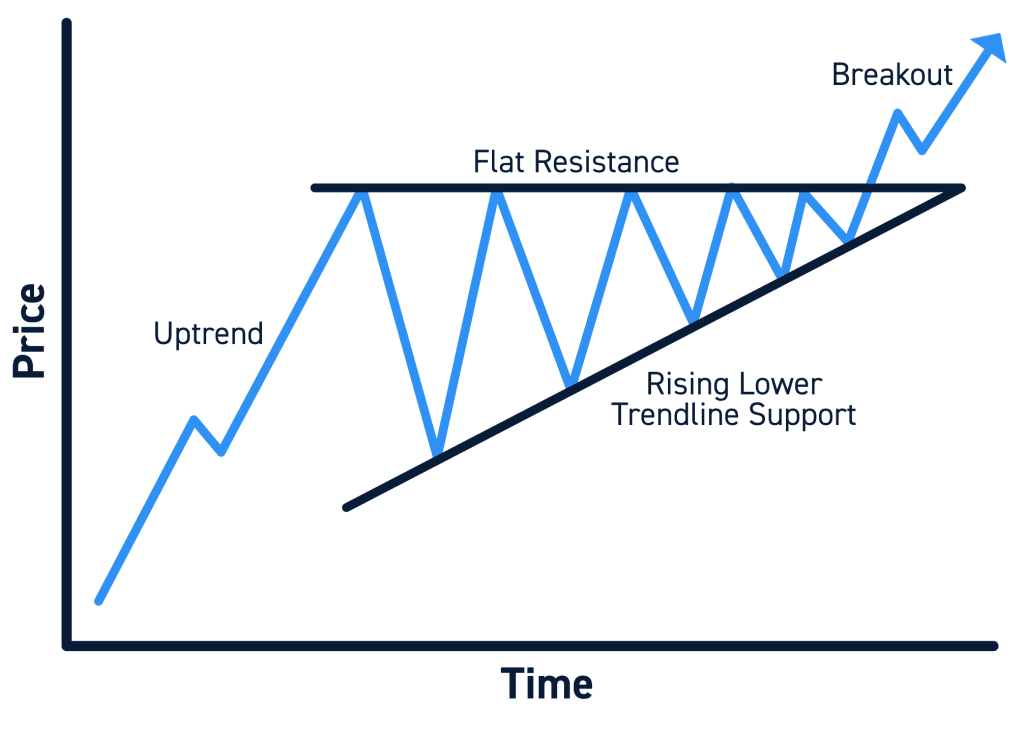
1) Ascending Triangle (bullish bias)
- Flat top (resistance doesn’t break)
- Rising bottom (support keeps moving higher)
- Shows buyers are pushing harder each time
👉 Often breaks upward.
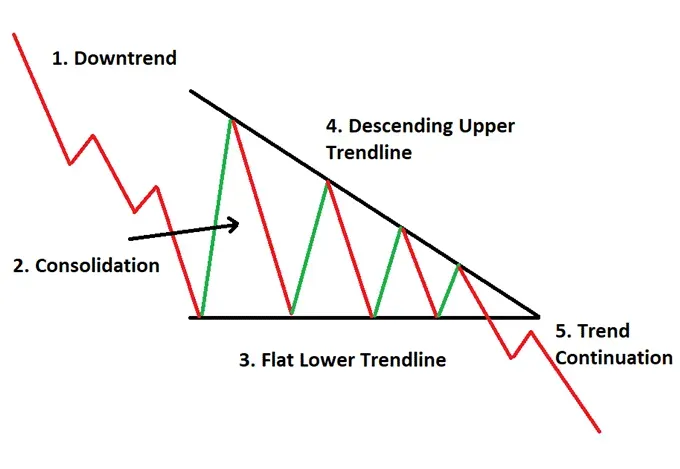
2) Descending Triangle (bearish bias)
- Flat bottom (support holding)
- Falling top (lower highs each time)
- Shows sellers are pushing harder
👉 Often breaks downward.
3) Symmetrical Triangle (neutral)
- Both highs and lows squeeze together
- Could break either way — traders wait for confirmation
🧑🤝🧑 Head & Shoulders
One of the most famous reversal patterns.
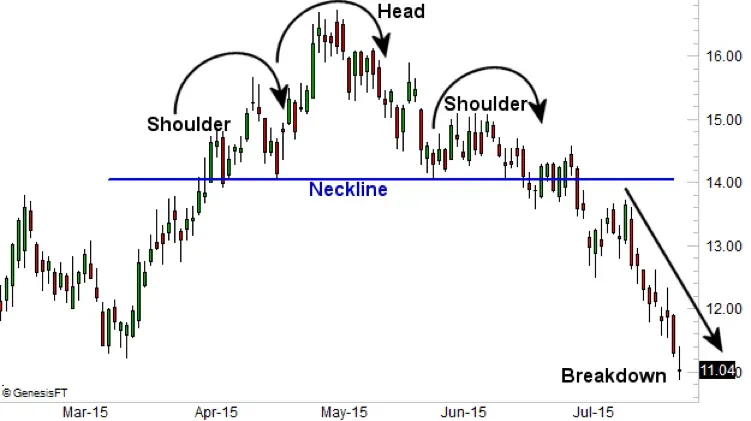
Head & Shoulders (bearish reversal)
- Left shoulder = small peak
- Head = taller peak
- Right shoulder = another small peak
- Neckline = support under the pattern
👉 If price breaks below the neckline, it often signals a bigger move down.
Inverse Head & Shoulders (bullish reversal)
- Same shape but flipped upside down
- Shows sellers getting weaker and buyers taking over
👉 If price breaks above the neckline, it often signals a bigger move up.
📉 Double Tops & Double Bottoms
Double Top (bearish)
- Price tests the same high twice
- Fails to break through
- Suggests sellers are strong at that level
👉 Often signals a downward reversal.
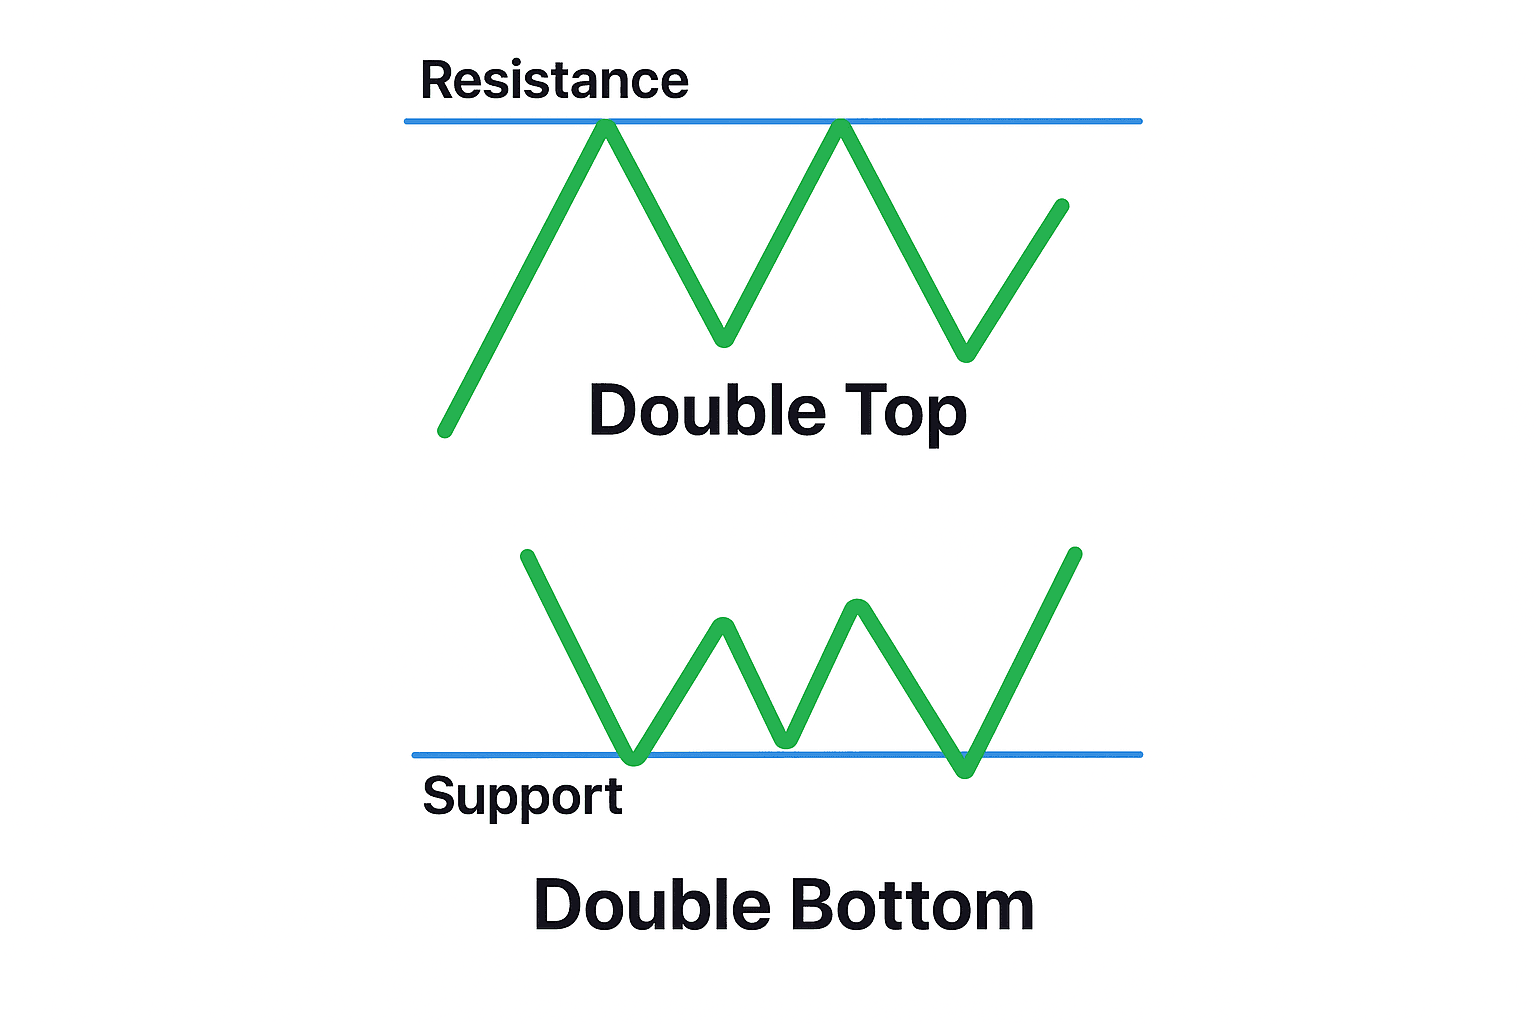
Double Bottom (bullish)
- Price tests the same low twice
- Buyers step in both times
- Suggests sellers are exhausted
👉 Often signals an upward reversal.
📊 Flags & Pennants
These patterns happen after a strong move (called a “pole”).
- Flag: Price moves sideways in a small rectangle after a big move.
- Pennant: Price squeezes in a small triangle after a big move.
👉 Both usually continue in the same direction as the pole.
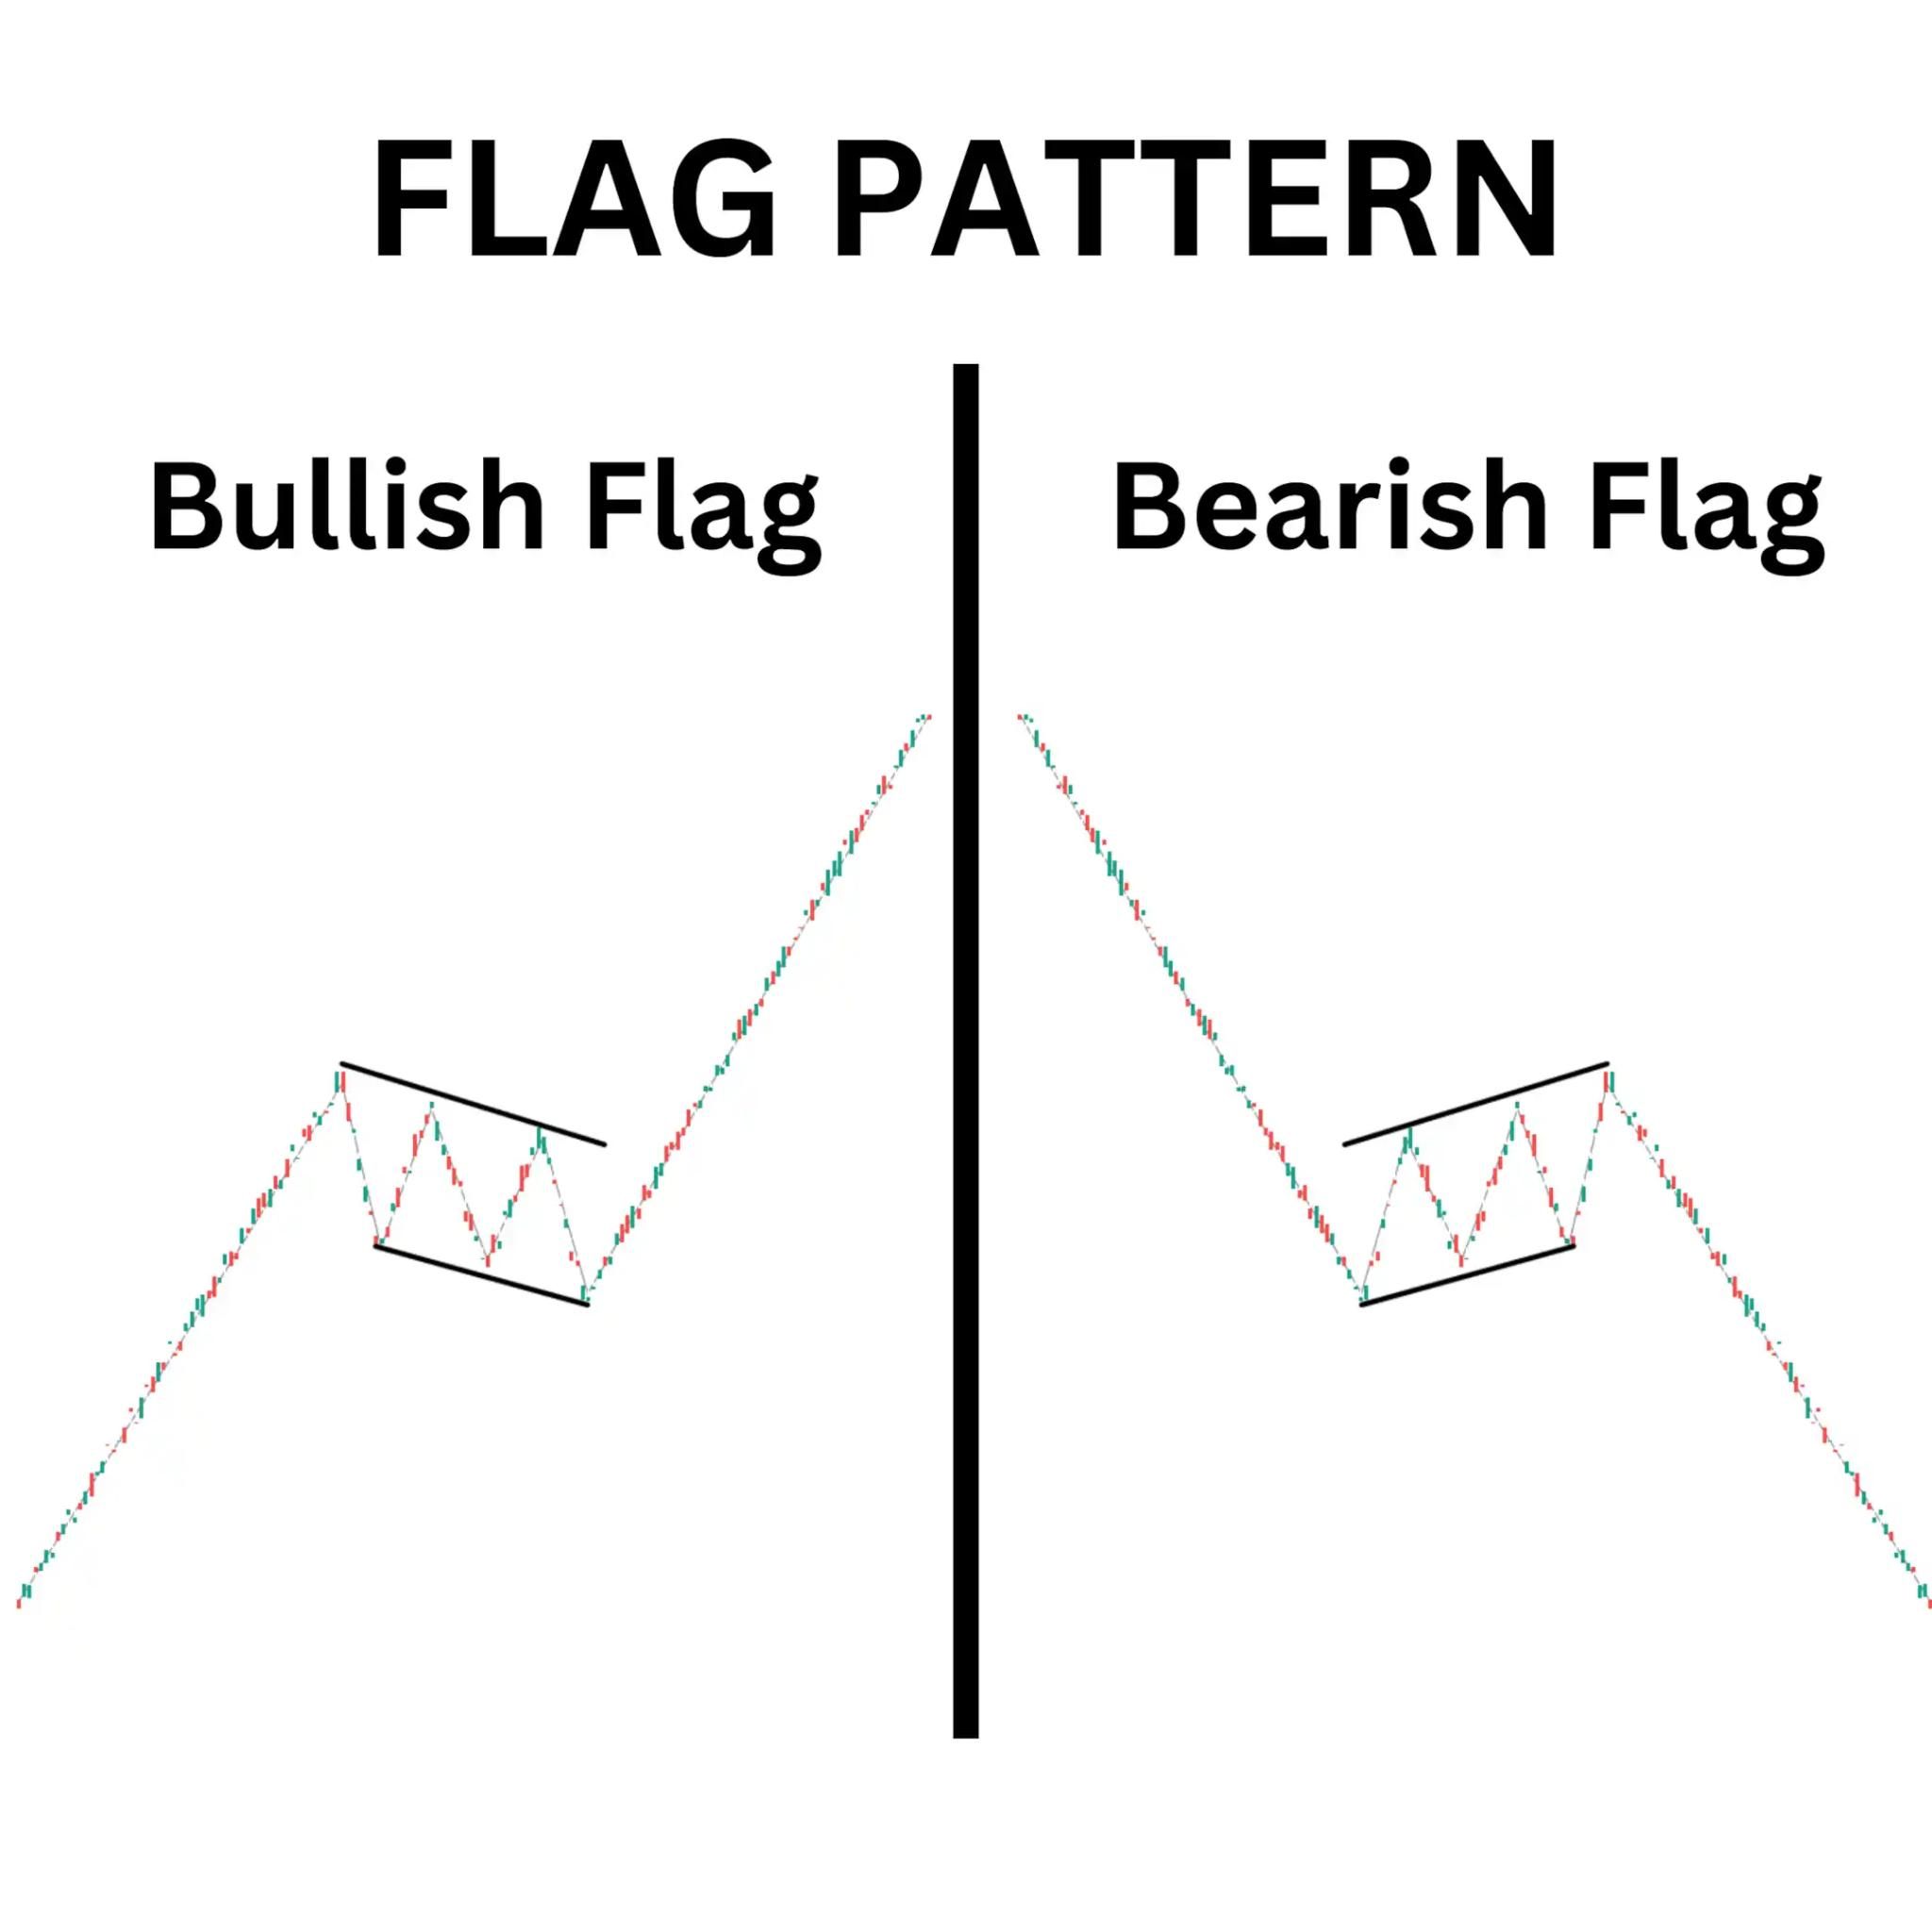
📝 Example
Imagine Tesla stock shoots up from $200 to $250 (the pole), then drifts sideways in a small box. That’s a bullish flag — and many traders expect another move higher once price breaks out of the box.
🚫 Common Mistakes
- Thinking patterns are guarantees (they’re just clues).
- Ignoring volume — strong breakouts usually come with higher trading volume.
- Forcing shapes — don’t draw a triangle where it doesn’t fit.
🎯 Quick Takeaways
- Triangles show pressure building before a breakout.
- Head & Shoulders signal reversals.
- Double tops/bottoms show strong rejection or support.
- Flags and pennants usually mean continuation of a move.
Patterns don’t work every time, but they help traders put the puzzle together. Combined with support, resistance, and risk management, they can give you a powerful edge.
🔑 Next is Moving Averages: Continue our Free Education in our Lesson Plan Here