Summary
Beginner’s guide to moving averages. Learn how the 50, 100, and 200-day MAs show trends, act as support/resistance, and signal market momentum.
Economic Data
- 📈 US Pending Home Sales: Dec 29, 2025
- 📈 US FOMC Meeting Minutes: Dec 30, 2025
- 📈 US Unemployment Claims: Dec 31, 2025
- 📈 New Years Day 2026 Bank Holiday: Jan 1, 2026
📚 Deep Dive 📚
Moving Averages: Understanding the 50, 100, and 200
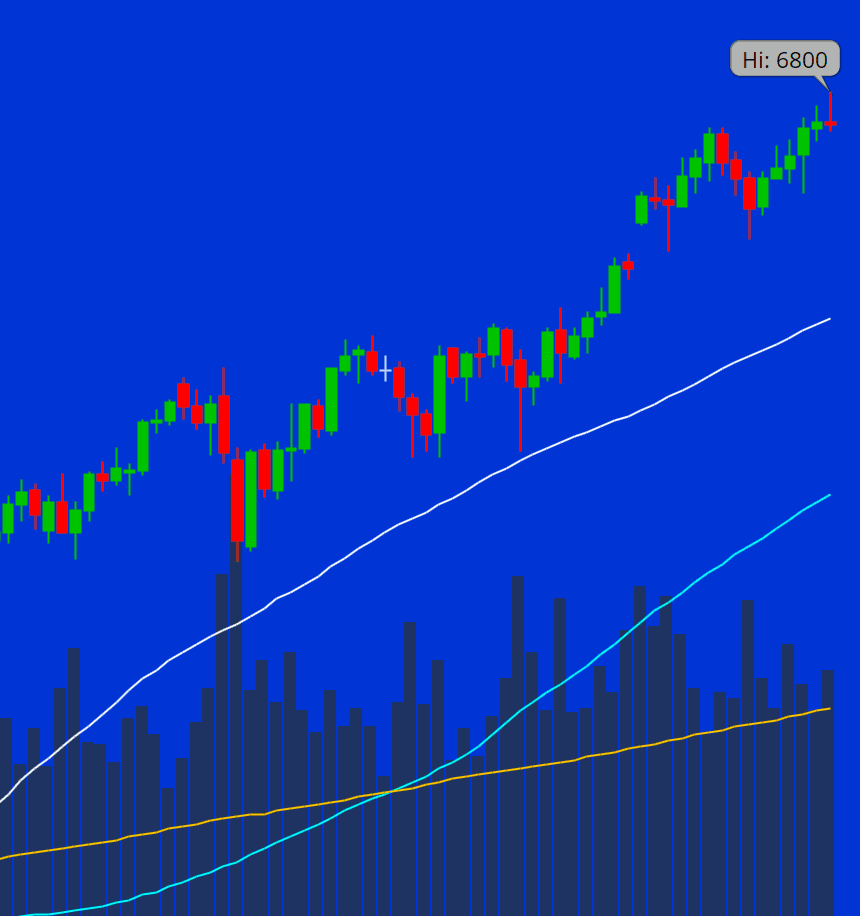
When you first look at a stock chart, all you see is price bouncing up and down. It can feel random. That’s where moving averages (MAs) come in — they smooth out the noise and show you the bigger picture.
At GAR Capital, we use the 50-day, 100-day, and 200-day moving averages as some of our favorite tools. Let’s break down what they mean and how to use them.
🧮 What is a Moving Average?
A moving average is just the average price of a stock over a certain number of days.
- 50-day MA = average closing price of the last 50 days
- 100-day MA = average closing price of the last 100 days
- 200-day MA = average closing price of the last 200 days
Every new day, the oldest day drops off, and the newest day gets added — that’s why it’s called moving.
👉 Think of it like a “rolling report card” that updates daily.
📈 Why Moving Averages Matter
Trend Direction
- If price is above the moving average, the stock is usually in an uptrend.
- If price is below, it’s usually in a downtrend.
Support & Resistance
- MAs often act like invisible “floors” (support) or “ceilings” (resistance).
Signals for Traders
- Crossovers between moving averages can signal changes in trend.
🔑 The Big Three: 50, 100, 200
50-Day MA
- Shorter-term view
- Shows the medium-term trend (about 2–3 months of trading days)
- Popular with swing traders
👉 Example: If Apple is trading above its 50-day MA, it often means short-term momentum is bullish.
100-Day MA
- More intermediate-term
- A balance between short-term and long-term views
- Used less often but still respected
👉 Example: If price dips to the 100-day MA and bounces, that’s a healthy sign of strength.
200-Day MA
- The big one — almost every trader and investor watches it
- Represents the long-term trend (almost a year of trading)
- When price is above, it’s considered a bullish long-term sign
- When price is below, many see it as bearish
👉 Example: If the S&P 500 breaks above its 200-day MA, news outlets often report it as a “bullish signal.”
⚡ Moving Average Crossovers
When shorter moving averages cross longer ones, traders take notice:
- Golden Cross: The 50-day MA crosses above the 200-day MA → Bullish signal
- Death Cross: The 50-day MA crosses below the 200-day MA → Bearish signal
They’re not perfect predictors, but they often confirm shifts in long-term momentum.
📊 Simple Moving Average (SMA) vs. Exponential (EMA)
- SMA = simple average (all days weighted equally)
- EMA = exponential average (recent days weighted more heavily)
👉 EMAs react faster to price changes, while SMAs are smoother and slower.
At GAR, we focus mainly on SMA 50, 100, 200, but EMAs are also widely used.
📝 Example
Imagine Netflix stock is at $400.
- The 50-day MA is at $390 (short-term support)
- The 100-day MA is at $375
- The 200-day MA is at $350 (long-term support)
If price bounces off these averages, traders see that as confirmation of strength. If price falls below them, it may suggest weakness.
🚫 Common Mistakes
- Using moving averages alone without context (always combine with price action).
- Expecting perfect bounces — sometimes price dips slightly below before reversing.
- Using too many MAs at once (it clutters the chart).
🎯 Quick Takeaways
- Moving averages smooth out price action and show trends.
- 50-day = short/medium term, 100-day = intermediate, 200-day = long term.
- MAs can act as support/resistance and signal trend changes with crossovers.
- They’re powerful, but best when combined with other tools (like support/resistance or chart patterns).
🔑 Re-read our entire Lesson Plan: Learning Center for Day Trading