Summary
Beginner’s guide to reading candlestick charts. Learn how to spot patterns like doji, hammer, and shooting star, and understand wicks, bodies, and trends.
Economic Data
- 📈 FOMC Meeting Minutes: Nov 19, 2025
- 📈 Non-Farm Employment Change: Nov 20, 2025
- 📈 Flash Manufacturing PMI: Nov 21, 2025
📚 Deep Dive 📚
Reading Candles, Bars, and Price Charts (Beginner Guide)
Charts are just stories of price over time. Once you learn how to read the “letters” in that story—candles and bars—everything starts to click.
1) What is a candlestick?
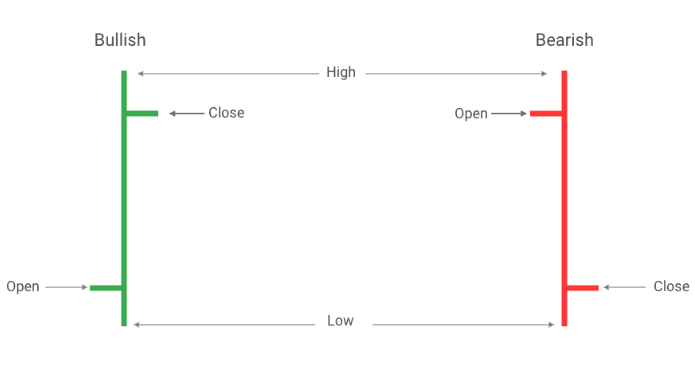
Each candlestick shows four prices for a chosen time period (1 minute, 5 minutes, daily, weekly, etc.):
- Open – where price started
- High – the highest price reached
- Low – the lowest price reached
- Close – where price ended
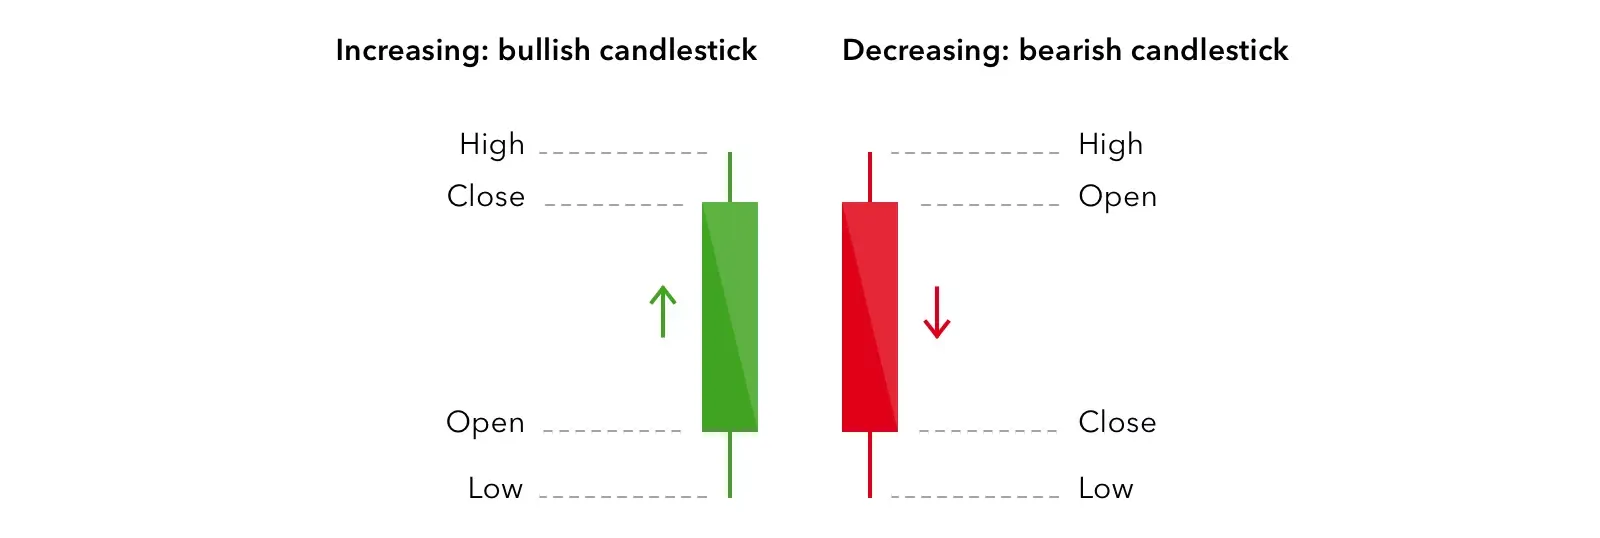
- Body color:
- Green/White (bullish): Close > Open
- Red/Black (bearish): Close < Open
- Wicks (shadows): Thin lines showing how far price moved beyond the body.
On a daily chart, each candle represents one trading day’s OHLC.
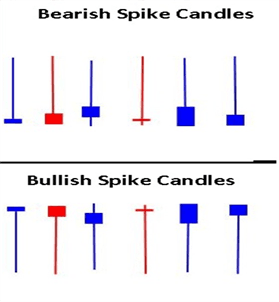
2) What a single candle can tell you
- Big body, tiny wicks → strong push (buyers if green, sellers if red)
- Small body, long wicks → indecision or rejection of certain prices
- Long lower wick → buyers stepped in and pushed price up from lows
- Long upper wick → sellers pushed price down from highs
Context matters! A long lower wick at support is more meaningful than the same candle in the middle of nowhere.
3) Popular single-candle patterns
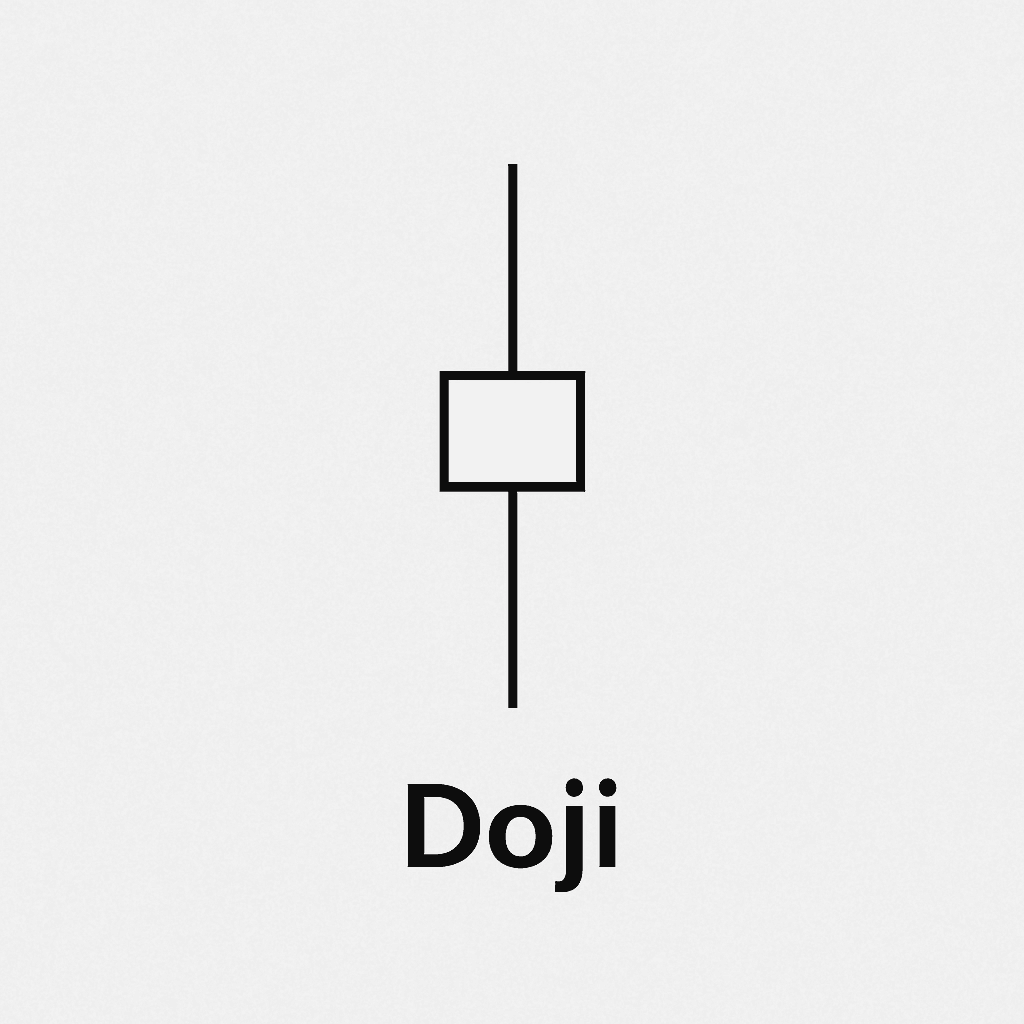
A) Doji (indecision)
- Meaning: Tug-of-war; neither side won.
- Best at: Key support/resistance after a strong move.
- Tip: Wait for the next candle for confirmation (up close after a doji at support = bullish hint).
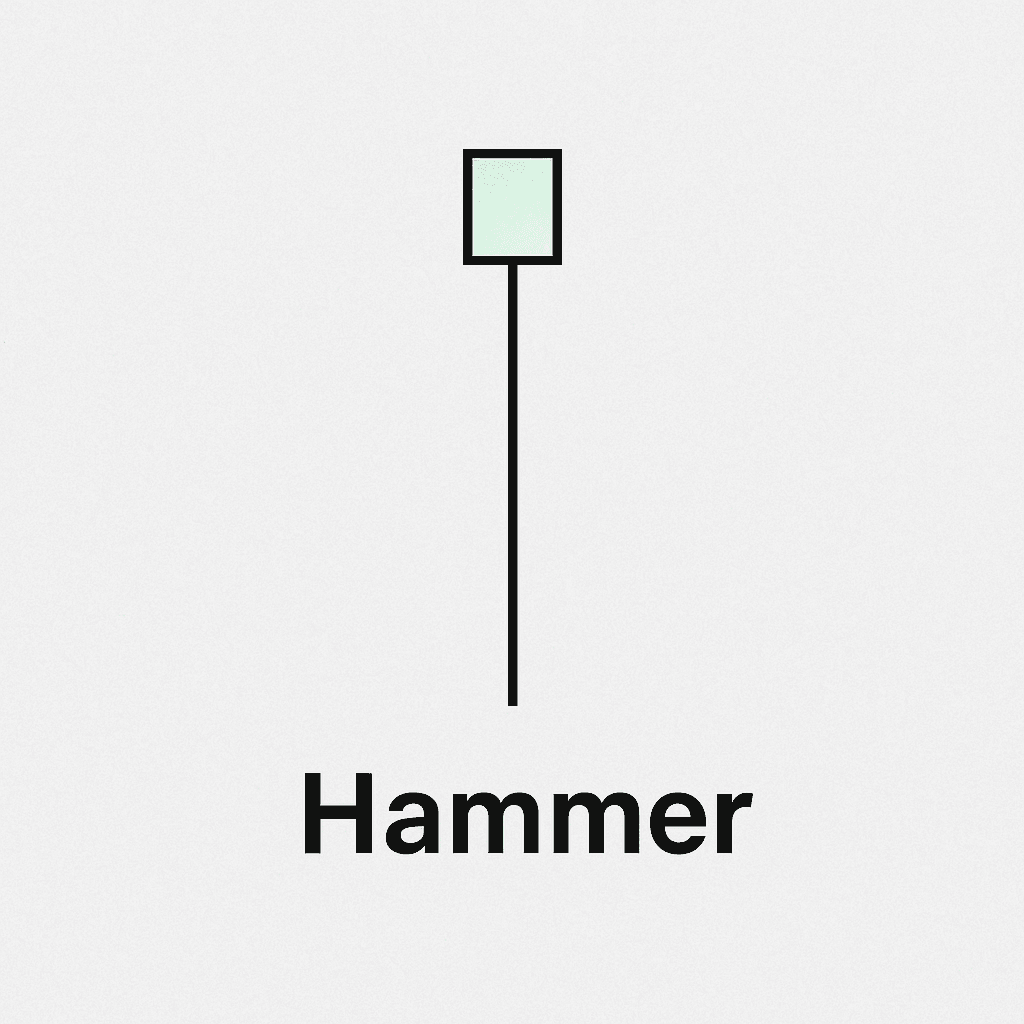
B) Hammer (bullish reversal hint)
- Features: Small body on top, long lower wick, little or no upper wick.
- Story: Sellers pushed down; buyers fought back and closed near the top.
- Best at: Downtrends / support zones.
- Risk idea: If entering long, many place a stop below the hammer’s low.
C) Shooting Star (bearish reversal hint)
- Features: Small body near the bottom, long upper wick.
- Story: Buyers pushed up; sellers smacked it back down.
- Best at: Uptrends / resistance.
- Risk idea: If entering short, some place a stop above the star’s high.

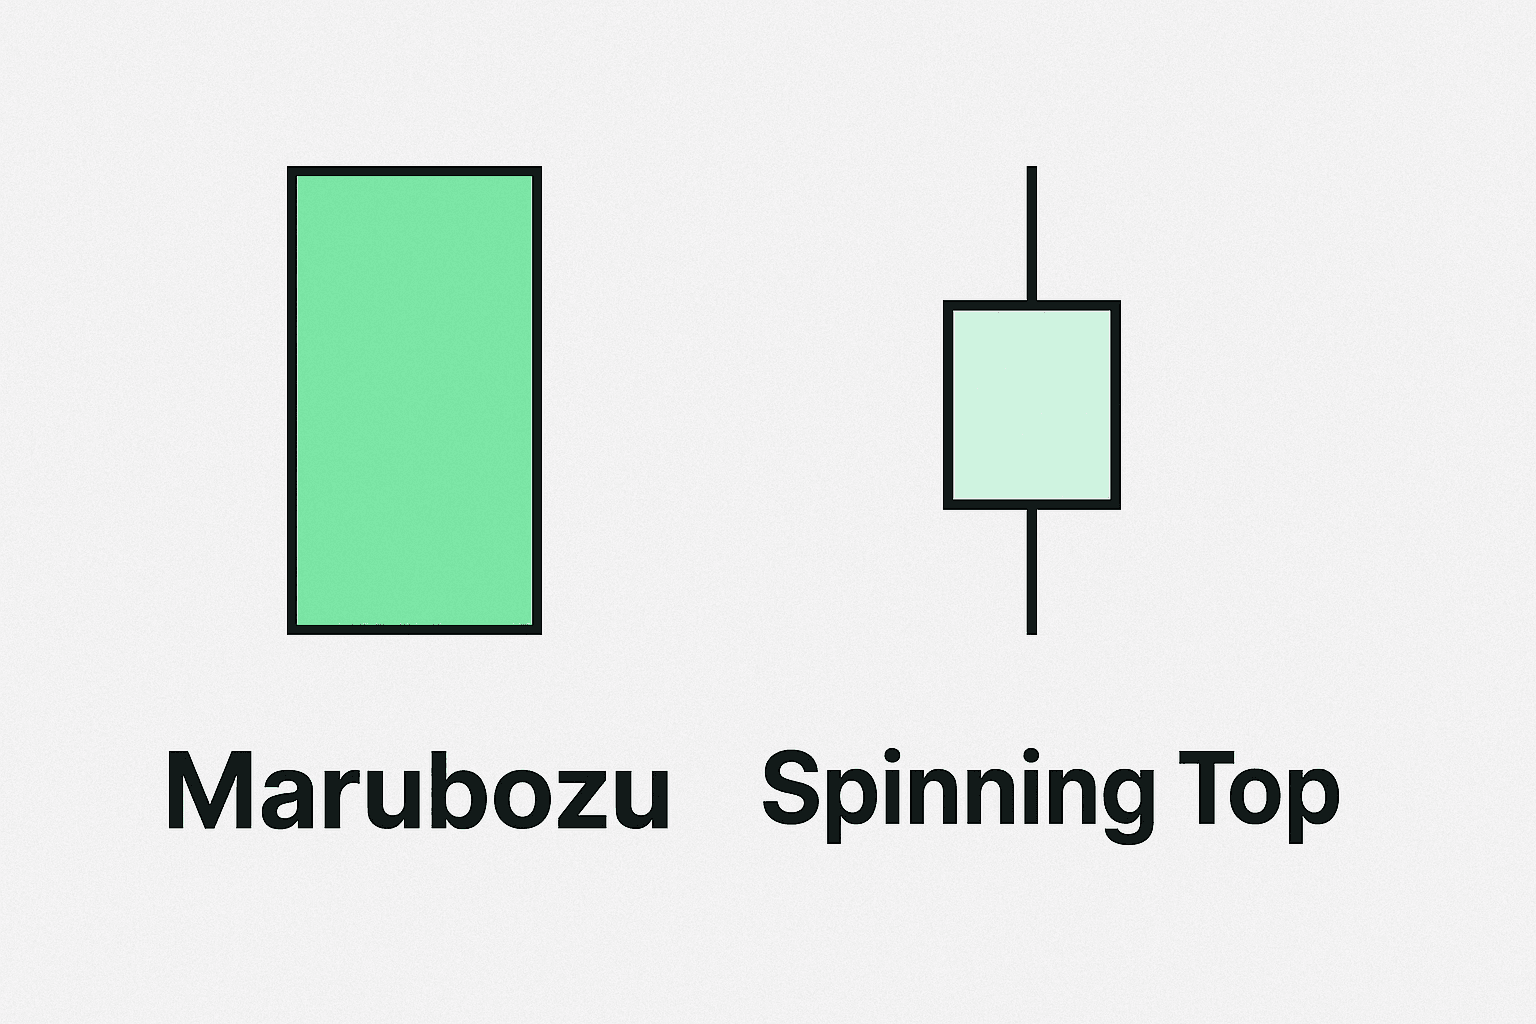
D) Marubozu (no wicks, full body)
- A candle with little/no wicks—pure momentum.
- Bullish marubozu in an uptrend = strong buying pressure.
- Bearish marubozu in a downtrend = strong selling pressure.
E) Spinning Top (small body, wicks both sides)
- Lighter indecision than a doji; shows balance/hesitation.
4) Two- and three-candle patterns (super common)
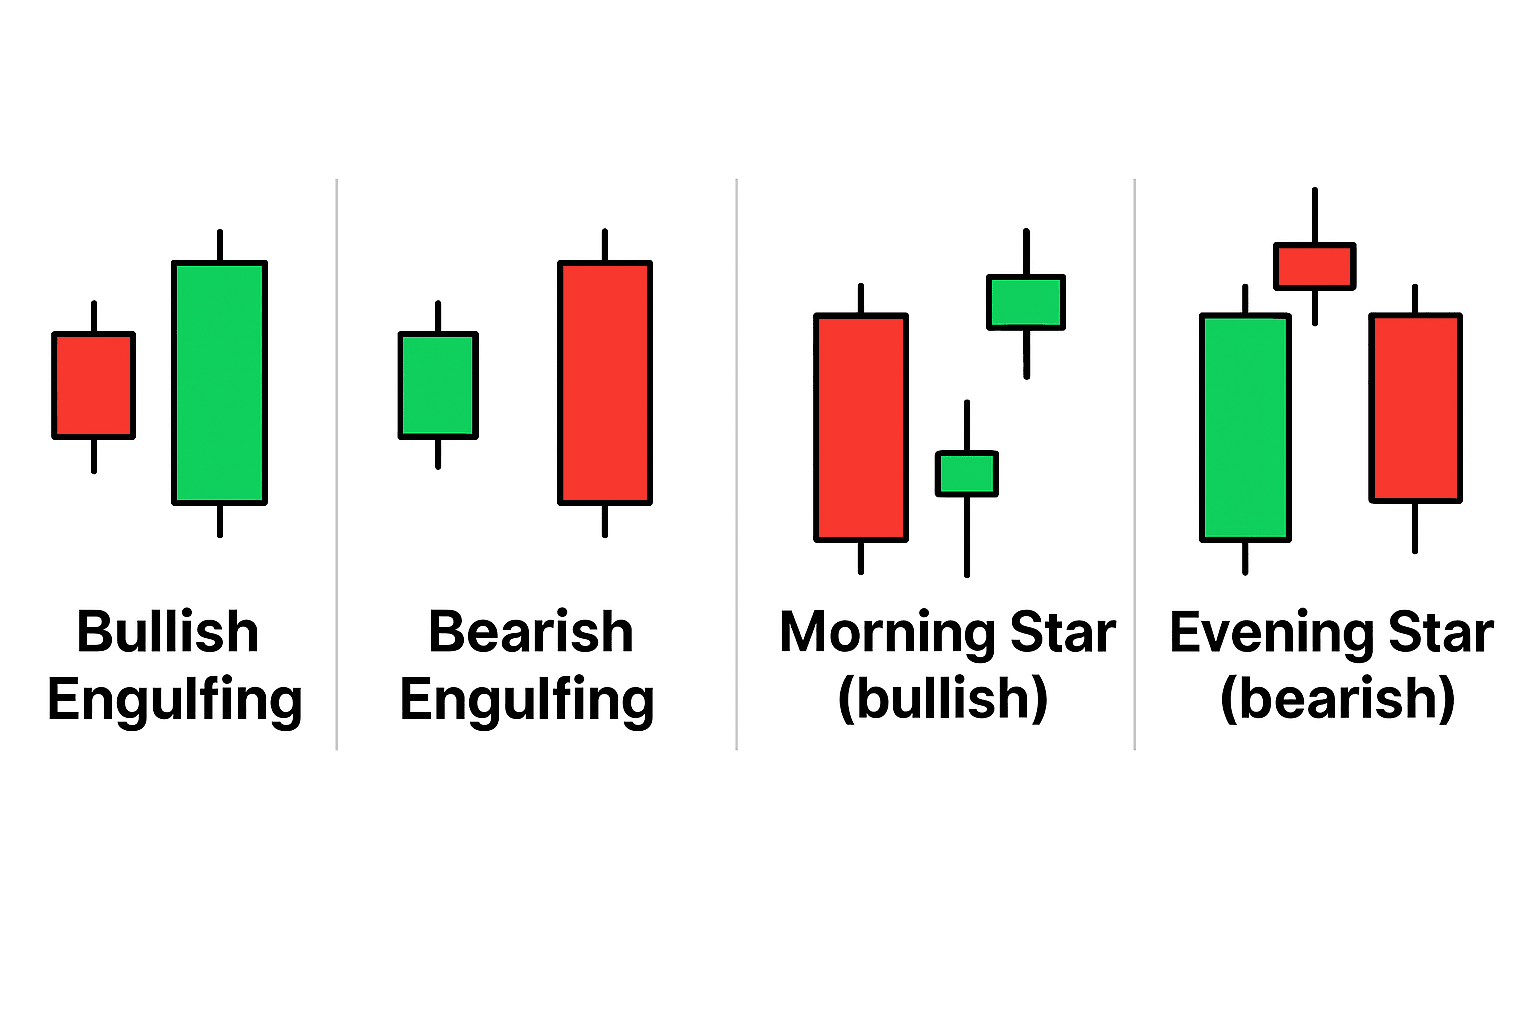
- Bullish Engulfing: Small red followed by larger green that engulfs the body → buyers take control (best near support / after a drop).
- Bearish Engulfing: Small green then larger red that engulfs → sellers take control (best near resistance / after a rally).
- Morning Star (bullish): Big red → small indecision (often a doji) → big green.
- Evening Star (bearish): Big green → small indecision → big red.
*Always check location (support/resistance/trend) and, if possible,volumefor confirmation.*
5) OHLC bars vs candles
An OHLC bar shows the same data as a candle without the colored body:
- Left tick = Open, right tick = Close.
- Some traders prefer bars for a cleaner, less “emotional” look; others prefer candles because they’re easier to read at a glance.
- Both tell the same story (OHLC).
6) Timeframes: intraday vs daily vs weekly
- Intraday (1m/5m/15m): Fast signals; more noise.
- Daily: Clearer “big picture”; common for swing trades.
- Weekly/Monthly: Macro trend; used by investors.
A hammer on the daily is stronger than a hammer on the 1-minute.
7) Checklists you can use
Before acting on a candle pattern:
- What’s the trend? (up, down, sideways)
- Are we near support/resistance?
- Is there confirmation? (next candle closes in your direction)
- Did volume increase on the signal?
- Where is your stop? (typically beyond the pattern’s wick)
- Is the reward (target) at least 2x your risk?
Example (daily chart):
Price rallies into prior highs (resistance). A shooting star forms. Next day closes lower (confirmation). Possible short with stop above the star’s high and target back to the nearest support.
8) Common mistakes to avoid
- Trading a doji or hammer without context (trend/SR).
- Ignoring confirmation—jumping in before the next candle.
- Setting stops inside the candle’s wick (easy to get “wicked out”).
- Using patterns alone without a plan for risk management and targets.
9) Mini-practice (quick quiz)
You see a long lower wick hammer on daily at support after a selloff. What might that suggest?
A: Buyers defended; possible bullish reversal if confirmed.Price hits a prior high and prints a shooting star with a long upper wick. What’s the message?
A: Rejection at resistance; possible bearish reversal if confirmed.Small body with wicks both sides and close ≈ open?
A: Doji/spinning top → indecision; wait for the next candle.
Key Takeaway
- Body shows who controlled the session; wicks show where control was tested and rejected.
- Patterns like doji, hammer, shooting star, and engulfing are clues—not guarantees.
- The location (trend + support/resistance) and confirmation are what turn a clue into a higher-quality signal.
🔑 Re-read this article in our Lesson Plan: Reading Candles, Bars, and Price Charts (Beginner Guide)
🔑 Next up in Charting & Price Analysis: Support & Resistance: How to Find Key Levels and Use Them in Trades