Summary
Beginner’s guide to RSI, MACD, and Stochastic indicators. Learn how traders use them to measure momentum, spot reversals, and confirm market trends.
Economic Data
📚 Deep Dive 📚
RSI, MACD, and Stochastic: Momentum Indicators Made Simple
After learning moving averages, the next step is momentum indicators. These tools don’t just tell you where price is — they tell you if the stock is moving too fast, slowing down, or ready to reverse.
The three most popular are RSI, MACD, and Stochastic Oscillator. Let’s break them down.
📊 Relative Strength Index (RSI)
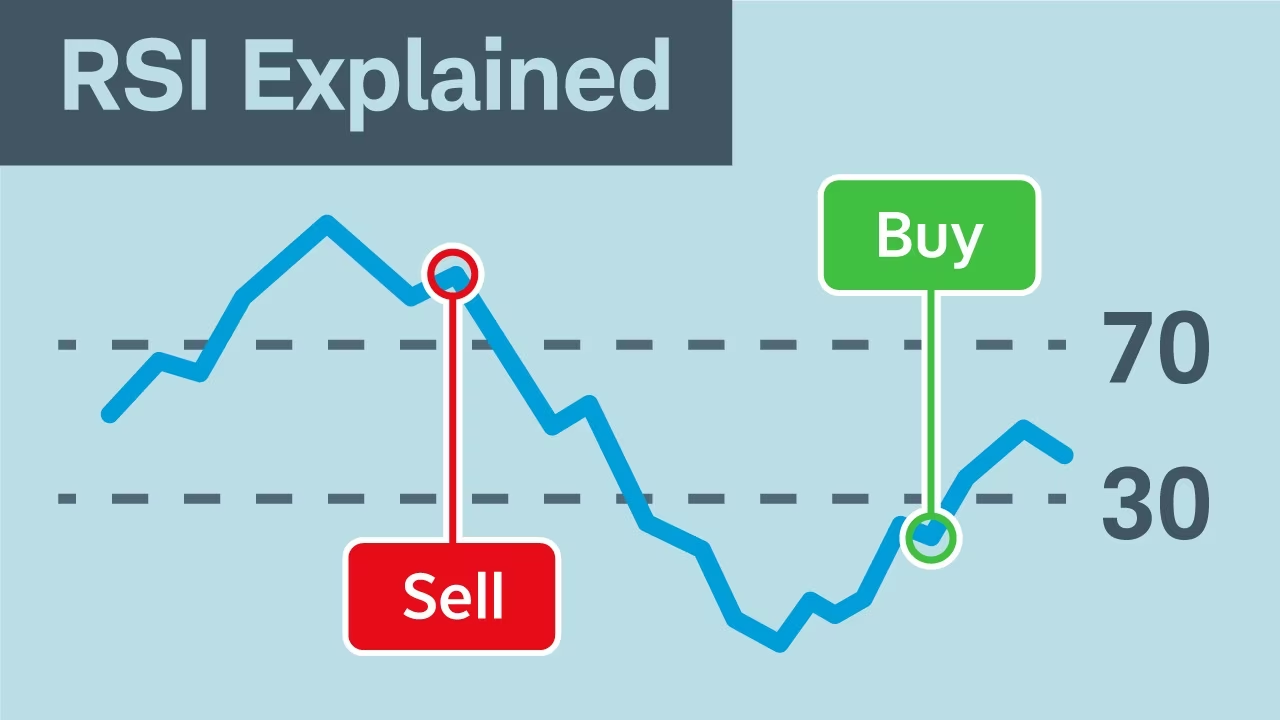
RSI measures whether a stock is “overbought” (too high too fast) or “oversold” (too low too fast).
- The scale runs from 0 to 100.
- Above 70 = overbought → price might pull back.
- Below 30 = oversold → price might bounce up.
- Middle around 50 = neutral.
👉 Example: If Tesla’s RSI is at 80, it means buyers have been too aggressive — a pullback may be near. If it’s at 25, sellers may be exhausted, and a bounce could happen.
⚡ Tip: Don’t use RSI alone. A stock can stay overbought or oversold longer than you think. Always check with trend and support/resistance.
📈 MACD (Moving Average Convergence Divergence)
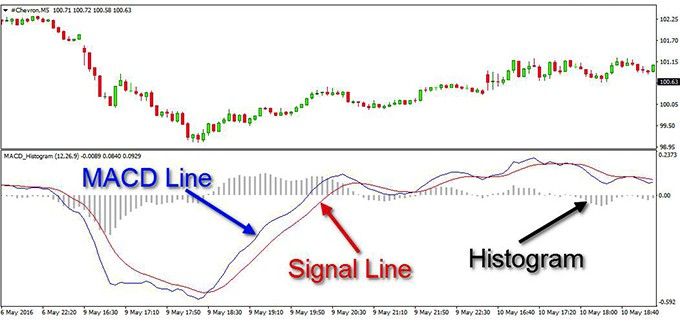
The MACD is like a “trend strength meter.” It uses two moving averages to show momentum.
- MACD Line = the difference between a short-term and long-term moving average.
- Signal Line = a moving average of the MACD line (slower).
- Histogram = bars that show the gap between the MACD line and signal line.
How to read it:
Crossovers
- When MACD line crosses above the signal line → bullish signal.
- When MACD line crosses below the signal line → bearish signal.
Above or below zero line
- Above = bullish trend momentum.
- Below = bearish trend momentum.
👉 Example: If the MACD crosses above the signal line while price is above the 200-day moving average, that’s strong confirmation of a bullish trend.
🔄 Stochastic Oscillator
The Stochastic indicator compares a stock’s closing price to its recent range.
- The scale runs from 0 to 100.
- Above 80 = overbought.
- Below 20 = oversold.
- Often shows signals earlier than RSI.
It has two lines: %K (fast) and %D (slow). When they cross, it can signal a change in momentum.
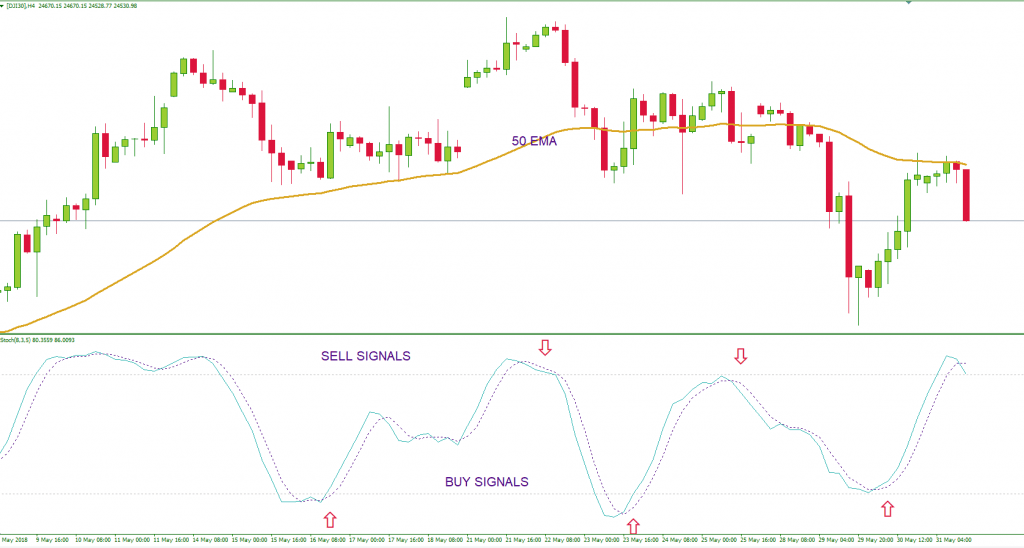
👉 Example: If Microsoft is near support, and Stochastic rises from 15 to above 20 (with %K crossing %D), it’s a bullish hint.
📖 Using Them Together
- RSI = “speedometer” (is price overbought or oversold?)
- MACD = “engine check” (is trend gaining or losing momentum?)
- Stochastic = “early warning system” (shows shifts before RSI sometimes).
Traders often use these together to confirm signals.
👉 Example: If RSI is oversold, MACD is crossing up, and Stochastic is turning up — that’s a stronger case for a bounce.
🚫 Common Mistakes
- Using momentum indicators alone without price action.
- Forgetting that “overbought” doesn’t mean “sell right away” (trends can run longer).
- Treating crossovers as guarantees — they are clues, not certainties.
Quick Takeaways
- RSI shows overbought/oversold.
- MACD measures trend strength and momentum.
- Stochastic compares closing price to recent range for early signals.
- Best when combined with support, resistance, and moving averages.
Momentum indicators give traders a feel for how strong or weak a move is — helping to avoid chasing tops or bottoms.
Trade Smarter With GAR Capital
At GAR Capital, we don’t just talk markets — we trade them. Our platform is built for traders who want structure, discipline, and real-time execution, not noise. Whether you’re just getting started or trading at a professional level, we offer tiered access designed to match your goals.
🥈 Silver Membership
Options Entries Only
- Real-time options trade alerts
- Clean, actionable entries and exits
- Perfect for traders who want simple execution without information overload
🥇 Gold Membership
Options + Futures Access
- Everything in Silver
- Futures trade alerts and market prep
- Daily and weekly technical breakdowns
- Ideal for active traders looking to expand beyond options
🏆 Lifetime Legacy Platinum
All Access – One Time Payment
- Lifetime access to options and futures alerts
- Long-term investment club trade ideas
- Dedicated reason-for-trade & chart analysis channels
- Weekly options watchlists + daily futures prep
- Live trading radio sessions
- Private Discord chatrooms for options and futures traders
- All future GAR Capital upgrades included
If you’re tired of guessing and ready to trade with a plan, GAR Capital gives you the tools, structure, and execution needed to stay consistent in any market environment.