
Summary
Beginner’s guide to support and resistance in trading. Learn how to identify key price levels, floors and ceilings, and why they matter for traders.
Economic Data
- 📈 Flash Manufacturing PMI: Nov 21, 2025
📚 Deep Dive 📚
Support & Resistance: The Foundation of Chart Reading
When you look at a stock chart, prices don’t move randomly. They often stop, bounce, or reverse at certain levels. These “key levels” are called support and resistance — and they’re some of the most important concepts in trading.
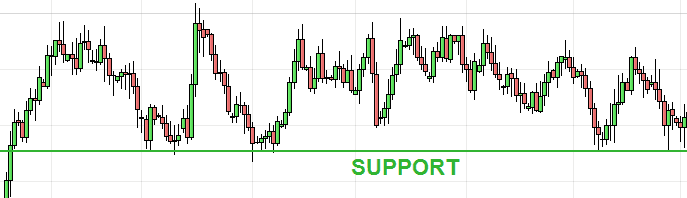
🟢 What is Support?
Support is a price level where buyers step in and keep a stock from falling lower.
Think of it like a floor: every time the price falls to this level, it finds support and bounces back up.
👉 Example: If Apple’s stock keeps bouncing around $150 and doesn’t fall below, $150 is a support level.
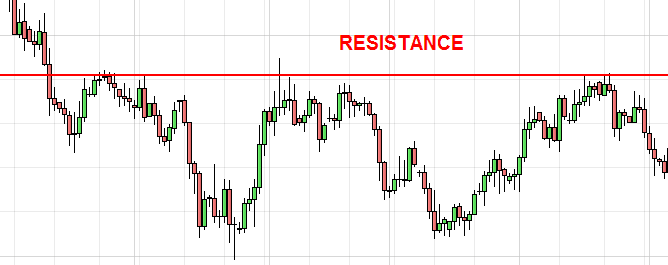
🔴 What is Resistance?
Resistance is the opposite of support — it’s where sellers step in and keep a stock from going higher.
It acts like a ceiling: every time the price climbs to this level, it struggles to break through and often pulls back.
👉 Example: If Tesla’s stock keeps hitting $300 and pulling back, $300 is a resistance level.
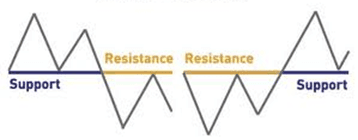
🔄 How Support & Resistance Work Together
- When support breaks, it can turn into new resistance.
- When resistance breaks, it can turn into new support.
👉 Example: If a stock finally breaks above $100 resistance, that $100 level often becomes new support. Traders call this a “role reversal.”
🧱 Why Do These Levels Matter?
- Decision Zones – Traders use them to decide when to buy or sell.
- Risk Management – Stop-loss orders are often placed below support or above resistance.
- Trend Confirmation – Breaking through resistance can signal strength. Falling through support can signal weakness.
📊 How to Spot Support & Resistance
Previous Highs and Lows
- Look left on the chart. Where did price bounce before? Where did it get rejected?
Round Numbers
- Stocks often react to big “psychological” levels like $50, $100, $1,000.
Moving Averages
- Lines like the 50-day or 200-day moving average can act as dynamic support or resistance.
- Trendlines
- Drawing diagonal lines connecting highs or lows can reveal hidden support or resistance zones.
📝 Example
Imagine Netflix stock has bounced off $400 three times in the past month. That’s a strong support level.
But every time it climbs near $450, it falls back down. That’s resistance.
A trader might buy near $400 with a stop slightly below (risk management) and sell near $450.
🎯 Quick Takeaways
- Support = floor where price struggles to go lower.
- Resistance = ceiling where price struggles to go higher.
- Once broken, support can become resistance and vice versa.
- Use past price action, round numbers, and moving averages to spot these levels.
Mastering support and resistance is like learning to read a map — it helps you know where price might turn, pause, or break out.
🔑 Re-read this article in the Learning Center: Support & Resistance: The Foundation of Chart Reading
🔑 Next article in the Learning Center: Trendlines & Channels: Drawing the Path of Price
📞 Book a Call to Join the Masterclass
If you’re serious about leveling up your trading and want direct, personalized guidance from Carlos G himself, book a call with our team. This is your chance to get all your questions answered, understand the full Masterclass roadmap, and see exactly how 1-on-1 coaching, lifetime access, and private mentorship can accelerate your growth.
Spaces are extremely limited during Black Friday, so secure your call now and make sure you don’t miss out on the best value GAR Capital has ever offered.