

Summary
Beginner’s guide to trendlines and channels in trading. Learn how to draw them, identify uptrends or downtrends, and use them to spot breakouts.
Economic Data
- 📈 Unemployment Claims: Nov 26, 2025
- 📈 US Holiday - Thanksgiving Markets Closed: Nov 27, 2025
📚 Deep Dive 📚
Trendlines & Channels: Drawing the Path of Price
Once you’ve learned about support and resistance, the next step is connecting those levels into trendlines and channels. These tools help you see the direction of price and the “path” it’s traveling on a chart.
📈 What is a Trendline?
A trendline is simply a straight line you draw on a chart to connect multiple highs or lows.
- If price keeps bouncing higher from a line, it’s an uptrend line (support).
- If price keeps falling from a line, it’s a downtrend line (resistance).
👉 Example: Imagine a stock that hits $50, $55, and $60 on three different rallies. If you connect those peaks with a line, you’ve drawn a downward resistance trendline if it keeps rejecting price.
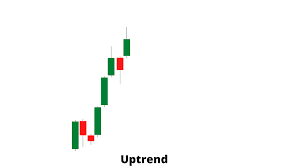
🔺 Uptrend Line
- Connects higher lows (each dip is higher than the last).
- Shows buyers are in control, pushing price up over time.
- Traders often buy near the line, placing stops just below it.
👉 Think of it like an uphill path. Every time price stumbles, it lands on the hill and keeps walking up.
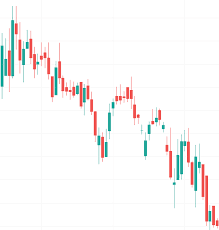
🔻 Downtrend Line
- Connects lower highs (each rally is weaker than the last).
- Shows sellers are in control, pushing price down over time.
- Traders often sell near the line, placing stops just above it.
👉 Think of it like a downhill slope. Every bounce upward just rolls back down again.
📊 What is a Channel?
A channel is formed when price moves between two parallel trendlines.
- Uptrend channel → Price moves higher, bouncing between two upward-sloping lines.
- Downtrend channel → Price moves lower, bouncing between two downward-sloping lines.
- Sideways channel → Price moves flat, bouncing between two horizontal lines.
👉 Picture it like train tracks: the price is the train, moving forward inside the rails.

🧭 Why Trendlines & Channels Matter
- Visual Roadmap – They show the overall direction of price.
- Buy & Sell Zones – Traders use the bottom of a channel (support) for buying and the top (resistance) for selling.
- Risk Management – Easy to know where to place stops (just outside the line).
- Breakouts – When price finally breaks through a channel, it often leads to a strong move.

📝 Example
Imagine Microsoft stock is trending upward between $250 and $280. Each dip lands near the lower line (support trendline), and each rally touches the upper line (resistance trendline).
- A trader could buy when price touches $250–$255, set a stop slightly below, and sell near $280.
- If price breaks above $280, that may signal a breakout to new highs.
🚫 Common Mistakes
- Forcing lines: Don’t bend lines to fit your bias. A valid trendline should touch at least two or three points clearly.
- Ignoring timeframe: Trendlines on a 1-minute chart are much weaker than those on a daily chart.
- Expecting perfection: Price may “wick” through a line before respecting it again. Trendlines are zones, not exact pennies.
🎯 Quick Takeaways
- Trendlines = slanted support/resistance lines.
- Channels = two parallel lines where price bounces up and down.
- They help identify direction, trading zones, and breakout opportunities.
- Always confirm with volume, price action, and larger timeframes.
Learning trendlines and channels helps you see the bigger picture on any chart — like drawing the outline of where price wants to go next.
🔑 Re-read this inside our Lessons Archive:Trendlines & Channels: Drawing the Path of Price**