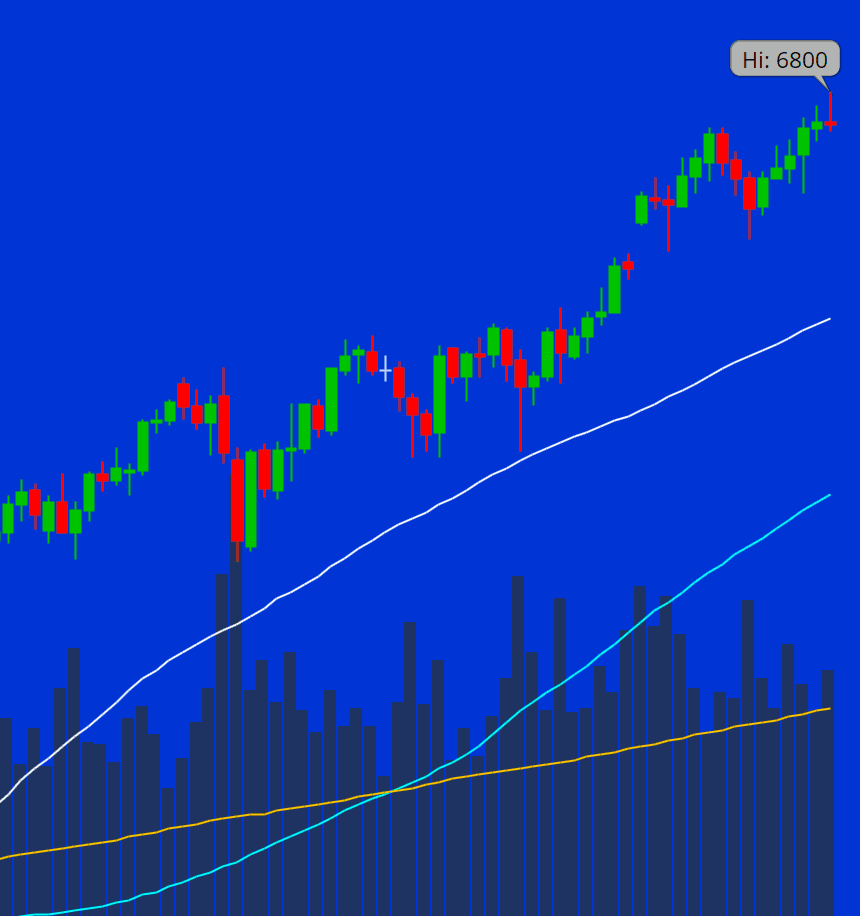
Moving Averages: Understanding the 50, 100, and 200
When you first look at a stock chart, all you see is price bouncing up and down. It can feel random. That’s where moving averages come in — they smooth out the noise and show you the bigger picture. At GAR Capital, we use the 50-day, 100-day, and 200-day moving averages as some of our favorite tools.
🧮 What is a Moving Average?
A moving average is just the average price of a stock over a certain number of days. 50-day MA is the average closing price of the last 50 days. 100-day MA is the last 100 days. 200-day MA is the last 200 days. Every new day, the oldest day drops off and the newest day gets added — it’s a rolling report card that updates daily.
📈 Why Moving Averages Matter
Trend Direction — if price is above the moving average, the stock is usually in an uptrend; if below, usually in a downtrend. Support and Resistance — moving averages often act like invisible floors or ceilings. Signals for Traders — crossovers between moving averages can signal changes in trend.
🔑 The Big Three: 50, 100, 200
50-Day MA: shorter-term view showing the medium-term trend and popular with swing traders. 👉 Example: If Apple is trading above its 50-day MA, short-term momentum is often bullish. 100-Day MA: more intermediate-term, a balance between short and long views; if price dips to the 100-day MA and bounces, that’s a healthy sign. 200-Day MA: the big one that many watch; above is bullish long-term, below is bearish; if the S&P 500 breaks above its 200-day MA, it’s often reported as a bullish signal.
⚡ Moving Average Crossovers
Golden Cross occurs when the 50-day MA crosses above the 200-day MA, a bullish signal. Death Cross occurs when the 50-day MA crosses below the 200-day MA, a bearish signal. They are not perfect predictors, but they often confirm shifts in long-term momentum.
📊 Simple Moving Average (SMA) vs. Exponential (EMA)
SMA is a simple average where all days are weighted equally. EMA is an exponential average where recent days are weighted more heavily. EMAs react faster to price changes, while SMAs are smoother and slower. At GAR, we focus mainly on SMA 50, 100, 200, but EMAs are also widely used.
📝 Example
Imagine Netflix stock is at $400. The 50-day MA is at $390 as short-term support. The 100-day MA is at $375. The 200-day MA is at $350 as long-term support. If price bounces off these averages, traders see that as confirmation of strength. If price falls below them, it may suggest weakness.
🚫 Common Mistakes
Using moving averages alone without context. Expecting perfect bounces; sometimes price dips slightly below before reversing. Using too many moving averages at once and cluttering the chart.
🎯 Quick Takeaways
Moving averages smooth out price action and show trends. 50-day is short or medium term, 100-day is intermediate, 200-day is long term. Moving averages can act as support or resistance and signal trend changes with crossovers. They are powerful, but best when combined with other tools like support or resistance and chart patterns.
🔑 Next in Indicators & Tools: Relative Strength Index (RSI): Measuring Overbought & Oversold