Oscillators & Momentum Indicators: Reading Market Strength
Trading isn’t just about where price is — it’s also about how strong the move is. That’s where oscillators and momentum indicators come in. We have gone over a few of these in previous lessons, so use this as a refresher. These tools swing back and forth, showing whether the market is moving too far, too fast, or slowing down.
📊 What is an Oscillator?
An oscillator is a technical indicator that moves within a range, like 0 to 100. It tells you if the market is overbought, meaning prices rose too quickly, or oversold, meaning prices fell too quickly. Oscillators swing up and down, which makes them easy to read on charts.
⚡ Popular Oscillators
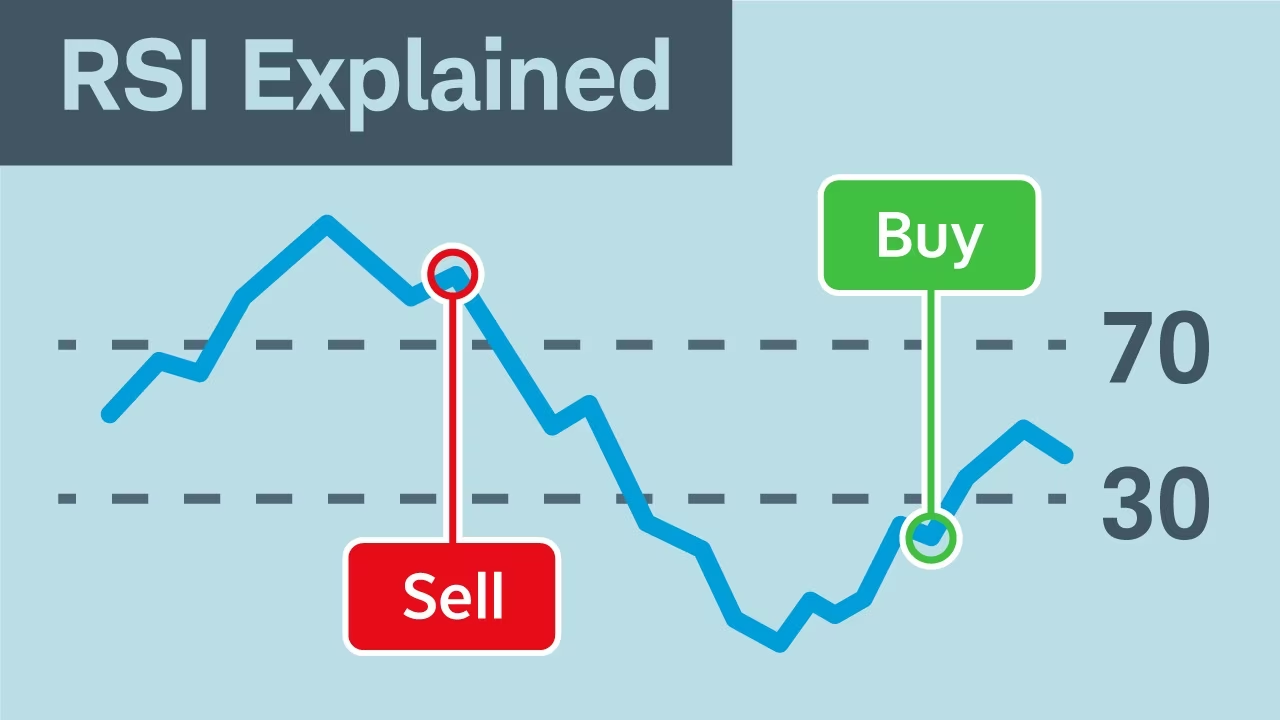
1) RSI (Relative Strength Index) - Scale 0 to 100. Above 70 is overbought. Below 30 is oversold. Middle around 50 is neutral. 👉 Example: If Tesla’s RSI is at 85, it’s likely overheated. If it’s at 20, it may be ready for a bounce.
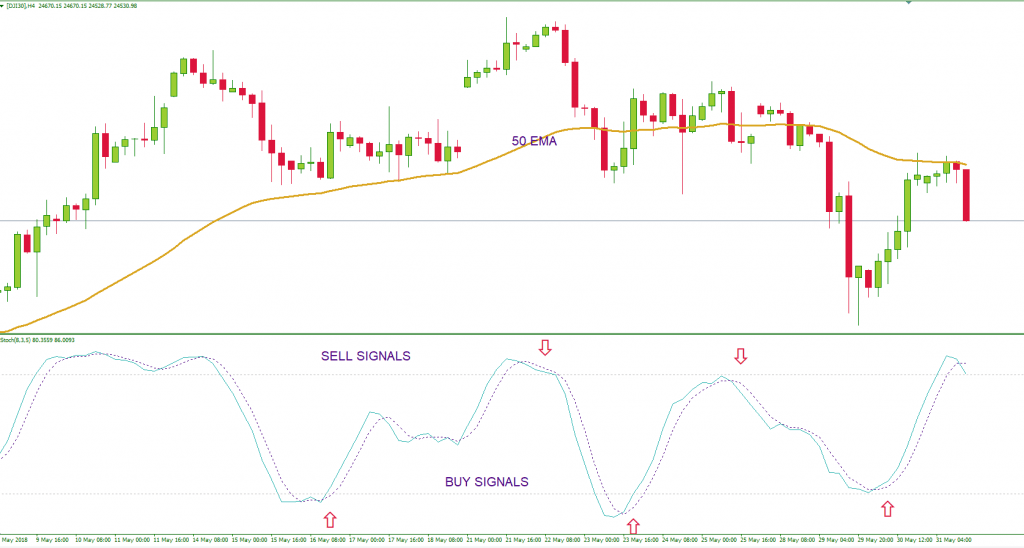
2) Stochastic Oscillator - Compares closing price to recent highs and lows. Scale 0 to 100. Above 80 is overbought. Below 20 is oversold. Often gives early signals compared to RSI. 👉 Example: If Microsoft is near support and Stochastic rises from 15 to 25, that’s a bullish hint.
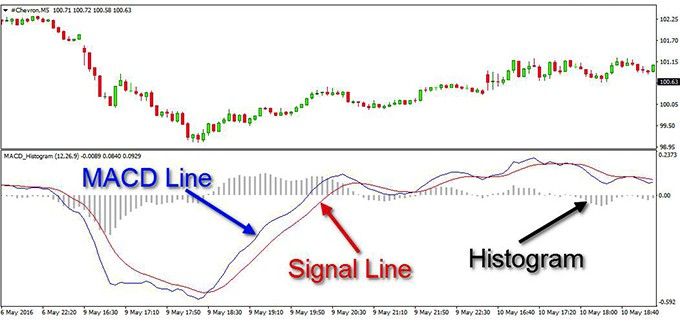
3) MACD (Momentum Oscillator) - Measures the difference between two moving averages and shows if momentum is speeding up or slowing down. Signals come from crossovers and histogram bars. 👉 Example: If the MACD line crosses above the signal line, momentum is turning bullish.
🚀 Why Momentum Matters
Momentum confirms strength — a breakout with rising momentum is stronger. It warns of weakness — if price rises but momentum falls, the rally may not last. It helps avoid traps by showing if a breakout is real or fake. Think of it like sports: A team may be winning, but if they’re losing energy, the game could flip quickly.
📖 Example in Action
Imagine Apple stock breaks above $200. If RSI is near 60 and rising, momentum is healthy. If MACD crosses upward, it confirms the breakout. If volume is high too, it’s a strong move. But if RSI is already at 85, Stochastic is overbought, and MACD is flattening out, the breakout might be running out of steam.
🚫 Common Mistakes
Using oscillators alone without trendlines or support/resistance. Selling just because something is overbought — it can stay that way longer than expected. Forgetting to confirm with volume and price action.
🎯 Quick Takeaways
Oscillators swing between overbought and oversold levels. RSI, Stochastic, and MACD are the most popular ones. They measure market momentum — the strength behind price moves. Best when combined with trend analysis, support/resistance, and volume. Momentum is like the fuel tank of a stock move. Once you learn to read it, you’ll know if price has the power to keep going or if it’s running out of steam.
🔑 Next Section After Indicators & Tools: Strategies & Tactics