RSI, MACD, and Stochastic: Momentum Indicators Made Simple
After learning moving averages, the next step is momentum indicators. These tools don’t just tell you where price is — they tell you if the stock is moving too fast, slowing down, or ready to reverse. The three most popular are RSI, MACD, and Stochastic Oscillator. Let’s break them down.
📊 Relative Strength Index (RSI)
RSI measures whether a stock is overbought or oversold. The scale runs from 0 to 100. Above 70 means overbought and price might pull back. Below 30 means oversold and price might bounce up. The middle around 50 is neutral. 👉 Example: If Tesla’s RSI is at 80, it means buyers have been too aggressive and a pullback may be near. If it’s at 25, sellers may be exhausted and a bounce could happen.
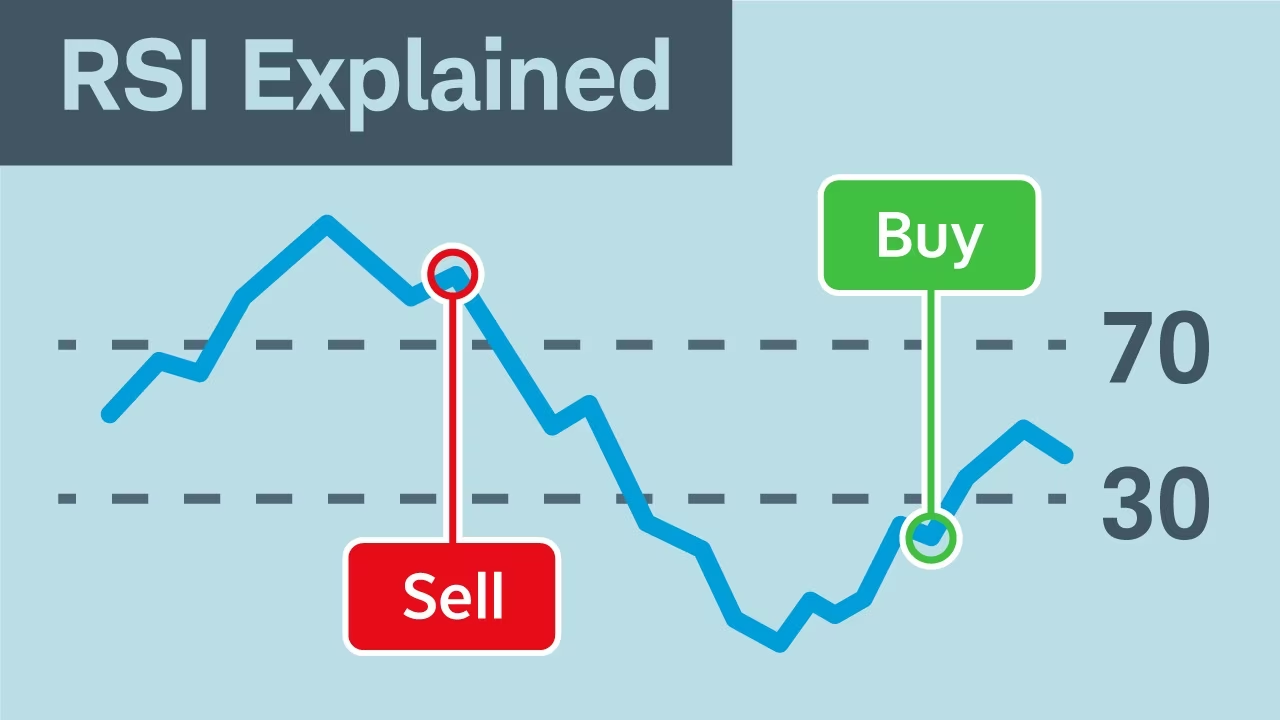
⚡ Tip: Don’t use RSI alone. A stock can stay overbought or oversold longer than you think. Always check with trend and support or resistance.
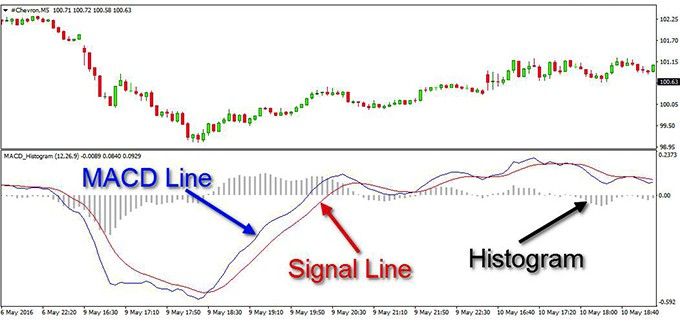
📈 MACD (Moving Average Convergence Divergence)
The MACD is like a trend strength meter. It uses two moving averages to show momentum. The MACD Line is the difference between a short-term and long-term moving average. The Signal Line is a moving average of the MACD line. The Histogram shows the gap between the MACD line and signal line.
How to read it:
1. Crossovers - When the MACD line crosses above the signal line, it’s a bullish signal. When it crosses below, it’s bearish.
2. Above or below zero line - Above means bullish trend momentum, below means bearish trend momentum. 👉 Example: If the MACD crosses above the signal line while price is above the 200-day moving average, that’s strong confirmation of a bullish trend.
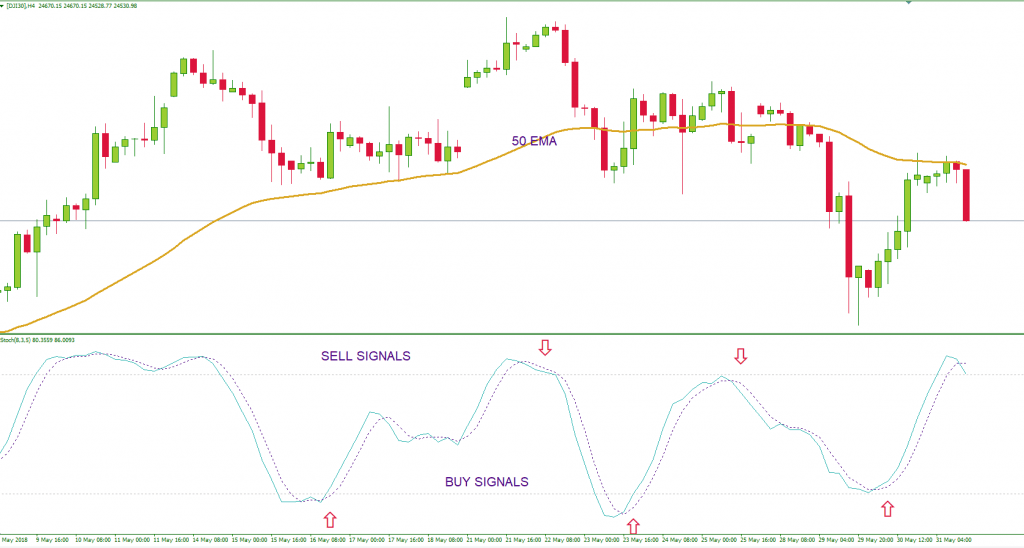
🔄 Stochastic Oscillator
The Stochastic indicator compares a stock’s closing price to its recent range. The scale runs from 0 to 100. Above 80 is overbought and below 20 is oversold. It often shows signals earlier than RSI. It has two lines, %K (fast) and %D (slow). When they cross, it can signal a change in momentum. 👉 Example: If Microsoft is near support and Stochastic rises from 15 to above 20 with %K crossing %D, it’s a bullish hint.
📖 Using Them Together
RSI acts like a speedometer showing if price is overbought or oversold. MACD acts like an engine check showing if the trend is gaining or losing momentum. Stochastic acts as an early warning system, showing shifts before RSI sometimes. Traders often use them together to confirm signals. 👉 Example: If RSI is oversold, MACD is crossing up, and Stochastic is turning up, that’s a stronger case for a bounce.
🚫 Common Mistakes
Using momentum indicators alone without price action. Forgetting that overbought doesn’t mean sell right away because trends can run longer. Treating crossovers as guarantees instead of clues.
🎯 Quick Takeaways
RSI shows overbought or oversold conditions. MACD measures trend strength and momentum. Stochastic compares closing price to recent range for early signals. They work best when combined with support, resistance, and moving averages. Momentum indicators help traders understand how strong or weak a move is and avoid chasing tops or bottoms.
🔑 Next in Indicators & Tools: Bollinger Bands: Measuring Volatility