Volume & On-Balance Volume (OBV): Why Trading Volume Matters
When you look at a stock chart, you usually see two things: price movement and volume bars at the bottom. Price tells you where the stock is going. Volume tells you how much energy is behind the move. At GAR Capital, we watch both. Here’s why volume and a special tool called On-Balance Volume (OBV) matter so much.
📊 What is Volume?
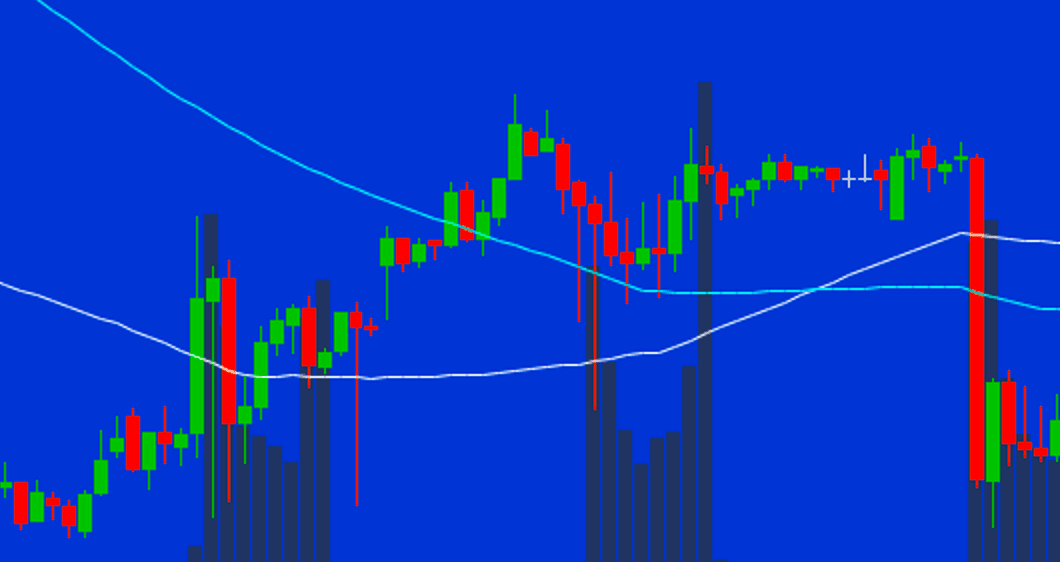
Volume is the number of shares (or contracts) traded during a certain period of time. High volume means lots of participation and strong conviction. Low volume means weak participation and uncertain conviction. 👉 Example: If Apple rises $5 in one day on low volume, it may not mean much. But if it rises $5 on huge volume, that’s a powerful sign that buyers are serious.
🔑 Why Volume Matters
1. Confirms Trends - A strong uptrend usually has increasing volume. If price rises but volume is shrinking, the trend may be weak.
2. Breakouts & Breakdowns - When price breaks above resistance or below support, volume is the truth test. A breakout with high volume is stronger than one with low volume.
3. Divergence Signals - If price moves up but volume falls, that’s a warning sign. If price falls but volume doesn’t rise, sellers may be weak.
📈 What is On-Balance Volume (OBV)?
On-Balance Volume (OBV) is a simple but powerful volume indicator. OBV adds volume on up days when price closes higher and subtracts volume on down days when price closes lower. This creates a running total that shows whether money is flowing into or out of a stock.
🧭 How to Use OBV
1. Confirm Trends - If price is going up and OBV is also going up, that’s strong confirmation. If price is going up but OBV is flat or falling, buyers may not be as strong as they look.
2. Spot Divergences - Price goes up, but OBV goes down, and the trend could reverse. Price goes down, but OBV goes up, showing accumulation by smart money.
3. Early Signals - OBV often moves before price. If OBV breaks higher while price hasn’t yet, it may be a clue that a breakout is coming.
📖 Example
Imagine Tesla stock is at $200. Price keeps rising, but OBV is flat, meaning buyers aren’t adding volume and caution is needed. Price is stuck sideways, but OBV is climbing, suggesting accumulation and a possible breakout.
🚫 Common Mistakes
Ignoring volume completely and just watching price. Believing OBV is always right, even though no indicator is perfect. Forgetting that news events can cause sudden spikes in volume.
🎯 Quick Takeaways
Volume measures the strength behind a price move. High volume means conviction, while low volume means a weak move. OBV combines price and volume to show money flow. Use volume and OBV to confirm trends, breakouts, and reversals. GAR uses high volume to find the best trades in options.
🔑 Next in Indicators & Tools: Bollinger Bands: Measuring Volatility